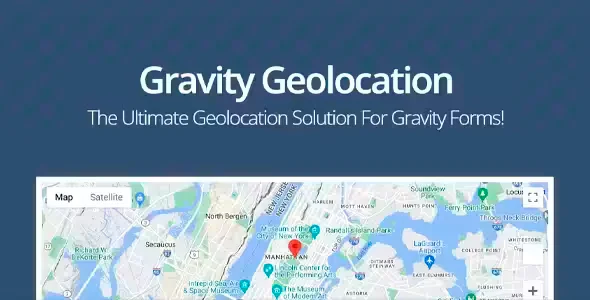
MapSVG Interactive Maps Plugin

$49.00 Original price was: $49.00.$4.99Current price is: $4.99.
MapSVG Interactive Maps Plugin is a WordPress solution that transforms SVG files and Google Maps into interactive mapping experiences, manageable from the back office without any coding. It's ideal for online stores, directories, or portals that need geographic data visualization, point-of-sale location, or region-based filters. It functions as a visual overlay on any structured WordPress content base.
Introduction to MapSVG Interactive Maps Plugin
When a WordPress operation needs to display geolocated information—delivery zones, pickup points, service coverage, or inventory distribution by region—without relying on expensive external solutions or custom development, MapSVG Interactive Maps Plugin solves that friction from the native editor, with full control over layers, markers, and internal databases.
The tool operates as an embedded mapping engine: it loads custom SVG maps or connects to Google Maps, builds internal databases of geographic objects, and allows filtering, searching, and rendering dynamic information without page reloads. This reduces reliance on external APIs for simple tasks and keeps the data logic within the WordPress environment, where the team already operates.
An administrator managing a network of physical stores can configure a coverage map by province, link each region to an entry in their catalog, and allow the customer to filter by area from the frontend, all from the usual control panel, without exporting data or maintaining external synchronizations.
Product overview
This plugin covers the geographic visualization layer in WordPress with a functional depth that goes beyond simply embedding a map: it allows you to build location systems, filters by region, and georeferenced databases that behave as embedded dynamic content, which is critical when the store or portal scales in the number of locations or geographic segments managed.
The difference between operating without this module and activating it is tangible from the very first deployment. Previously, displaying an interactive map required external solutions, generic shortcodes, or custom development that someone had to maintain. With the tool active, the workflow changes completely.
- Without the add-on: The team uses static Google Maps iframes or generic plugins that do not allow linking markers to their own data, forcing them to update two systems when a location changes.
- With the active add-on: Each region of the SVG or each marker on the map connects directly to an entry in the plugin's internal database, editable from the back office with custom fields, images, and links.
- Observable result: The team updates a location from a single point, the map reflects the change in real time, and the customer sees consistent information without inconsistencies between what the map says and what the product or point-of-sale information says.
Requirements and compatibility
Before deploying this module to production, it is advisable to check that the WordPress environment has adequate support for SVG files if custom maps are to be loaded, that the media upload permissions configuration allows it, and that any security plugin does not block the execution of map rendering scripts on the frontend.
- It relies on WordPress as its base platform; it does not require WooCommerce to function, although it integrates with it when you need to link geographical areas to shipping rules or delivery zones.
- Compatible with common page builders using shortcodes and blocks; works on product pages, landing pages, directories, and location listings.
- It is advisable to validate the behavior in staging environments when using large SVGs or internal databases with many records, as rendering can be affected by server memory limits.
Key benefits for your operation
- Elimination of dual location management: Maintaining a list of points of sale in one spreadsheet and a map on another platform inevitably leads to inconsistencies. This extension centralizes the data in WordPress, so a single edit simultaneously updates both the database and the visual representation. Fewer steps, fewer errors, and less coordination time between teams.
- Geolocated user experience without external development: Customers looking for the nearest pickup point or wanting to know if their area is covered get an immediate visual answer. The tool renders interactive filters on the map without the need for additional search plugins, simplifying the site architecture and improving loading times.
- Granular control over layers and visual styles: Each region, marker, and tooltip is configurable from the dashboard without advanced CSS. This allows the marketing manager to adjust colors per campaign, hide inactive areas, or highlight priority regions without relying on the technical team for every aesthetic change.
- Internal database of geographic objects: The module doesn't rely solely on WordPress posts or taxonomies to store location data; it generates its own data structure optimized for geographic queries. This improves performance in catalogs with many entries and facilitates future exports or integrations.
- Integration with WooCommerce shipping zones: For stores that manage regional pricing or delivery restrictions, being able to visualize those zones on an interactive map reduces configuration errors and facilitates review by any team member, not just the technician who originally set up the rules.
- Scalability without redesign: Adding new regions, new markers, or new types of geographic objects doesn't require modifying the plugin's structure or hiring additional development staff. The tool scales with operations, protecting the initial investment as the business grows or diversifies its geographic coverage.
Key features of the MapSVG Interactive Maps Plugin
- SVG visual map editor: It allows you to upload any SVG file—a country map, a building plan, a zoning diagram—and turn each region into an interactive object with associated events, colors, and data. In a store with regional distribution, this translates into being able to display availability by zone without third-party APIs.
- Internal database with custom fields: Each marker or region can store text fields, images, URLs, and metadata configurable from the back office. When the content team updates the information for a point of sale, the change is automatically reflected on the map without technical intervention.
- Search engine and filters on the map: Visitors can search by name, category, or custom attribute and see the results highlighted directly on the map. This reduces friction in the service point location process and improves conversion rates on pages where location is a deciding factor.
- Support for Google Maps as a base layer: When real-world geographic context—streets, satellite imagery, terrain—is needed, the tool can use Google Maps as a background while keeping the markers and data in WordPress's internal database. This offers the visual familiarity of Google Maps with the data control inherent to the environment.
- Configurable popups and detail windows: When the user clicks on a marker or region, they see an information window whose content and design are defined from the panel. For a store, this could mean displaying opening hours, phone number, a link to the catalog by area, or any other information the business needs without having to modify templates.
- WordPress shortcodes and blocks: The map can be embedded in any page, post, or widget using a shortcode or native block, making it compatible with any theme or page builder without the usual integration conflicts. The team can place the map wherever the content strategy requires without relying on special code areas.
Who is this product for?
This plugin is designed for WordPress operators who need to transform geographic data into interactive visual experiences without outsourcing development or maintaining separate infrastructure. Anyone managing a network of retail locations, coverage areas, or a directory with a geographic component will find this tool a solution that integrates seamlessly with their existing environment.
- Administrators and technicians who need traceability of what information appears in each area of the map and want to be able to audit or modify it without accessing external systems.
- Teams that manage multiple sites or projects with recurring mapping needs and are looking for a reusable solution with consistent configuration across facilities.
- Marketing and UX managers who design location flows for the end customer and need control over the visual appearance of the map without depending on a developer for every campaign adjustment.
Real-world use cases
- Collection point network for a WooCommerce store: A store with multiple pickup points needed customers to easily identify the nearest one before completing their purchase. This module enabled them to configure a regional SVG map with markers linked to each pickup point, including opening hours and address as custom fields. Customers can filter by city, view available pickup points, and proceed to checkout with their decision already made, reducing abandonment at that stage of the customer flow.
- Distributor portal with coverage by province: A manufacturer with a distributor network needed to show which areas had active coverage without manually updating a static image every time a distributor changed. The tool allowed them to link each province in the SVG to an editable field; when a distributor's status changes, the administrator updates a field, and the map instantly reflects the change. The result: information that is always consistent with operational reality.
- Directory of services with geographic filter: A local services portal needed users to be able to filter providers by area without leaving the page. This plugin built an interactive map with search by category and region; users see the results on the map and access the provider's profile from the popup. Geographic navigation replaced a flat list that led to users abandoning the site due to information overload.
- Display of shipping zones for internal management: The operations team of a store with regionally differentiated shipping rates lacked a clear way to visually review which zones corresponded to which rate. With the SVG map overlaid on the WooCommerce zones, any team member can verify the settings without opening the shipping panel. This eliminated rate allocation errors that were previously only detected when a customer complained at checkout.
Frequently Asked Questions about the MapSVG Interactive Maps Plugin
Does it work with any WordPress theme or do I need a specific theme?
The module integrates using standard WordPress shortcodes and blocks, making it compatible with most themes that adhere to core conventions. It is not theme-dependent. That said, highly customized themes that modify frontend script loading may require a review of the asset queuing order to ensure map rendering isn't blocked by aggressive performance optimizations such as generic JavaScript concatenation or deferral.
How does it affect the end customer browsing the store? Does it slow down the page?
The impact on customer experience depends primarily on the size of the SVG used and the number of markers or records loaded on the map. For moderate configurations, rendering is smooth and introduces no perceptible latency. On pages with very dense maps, it's advisable to evaluate whether to load the map asynchronously to avoid impacting the first interaction time, especially on mobile devices where connection speeds can be variable.
Does it allow you to configure rules or conditions on map objects?
Yes. The tool allows you to define different visual states for each region or marker based on conditions configured in the internal database: active, inactive, featured, or categorized areas can be rendered with different colors, icons, or behaviors. This allows you to build conditional display logic without code, which is useful for campaigns based on region, seasonal availability, or service type.
Does it have any features related to payments or renewals?
This module does not manage payments, subscriptions, or renewals. Its function is strictly cartographic and for managing geospatial data within WordPress. If the project requires linking map areas to payment or subscription terms by region, that logic must be configured in WooCommerce or the corresponding subscription plugin, using this plugin only as a visual reference layer.
Can it be used to show shipping zones or restrict products by region?
The tool can display shipping zones on a map, making it easier to review and communicate this configuration to both the internal team and the end customer. However, the logic for shipping restrictions or pricing by zone resides in WooCommerce; this module doesn't replace that configuration but rather complements it visually. The combination of both ensures consistency between what the customer sees on the map and what they experience at checkout.
How does it handle a large catalog or many simultaneous bookmarks?
High-volume performance depends on server capacity and how queries to the plugin's internal database are structured. For catalogs with hundreds of bookmarks, it's advisable to enable result pagination in the settings panel and avoid loading all objects simultaneously on the map. Testing in a staging environment with real data before going live is the best practice for identifying bottlenecks without impacting the client.
Is it viable to use it in a multisite installation or in several independent projects?
The plugin can operate on WordPress multisite installations, although map database management is handled at the individual site level, not the global network. Each subsite maintains its own maps and data, enabling operational consistency across networks of sites with varying geographic needs. For teams managing multiple independent projects, the configuration is replicated from scratch on each installation, requiring rigorous documentation to maintain consistency across projects.
How do I know if the map is working correctly once it's set up?
A practical checklist includes: verifying that the SVG loads without errors in the browser console, confirming that bookmarks or regions display the correct data when clicked, verifying that search filters return results consistent with the internal database, reviewing mobile behavior with different screen sizes, and confirming that data updates in the back office are reflected in the front end without stale caching. If the environment uses aggressive caching, clearing the cache after each content update is part of the standard workflow.
Short description
Convert SVG files and Google Maps into interactive maps manageable from WordPress, with an internal database, dynamic filters, and markers linked to real-world content. No coding, no external platforms, and complete control from the back office.
Written and reviewed by the PrimeGPL Team
At PrimeGPL, we ensure that every piece of published content is verified and reviewed by our team. We analyze features, compatibility, and performance to provide you with clear, up-to-date, and truly useful information for each product listed in our store.
Get your questions answered here
We answer your questions so you can buy in an informed and confident manner.
Does my purchase include updates?
Yes. Every product purchase includes lifetime updates, so you won't have to pay extra under any circumstances.
Is there a daily download limit?
No, not at all. After your purchase, you can download it as many times as you need, without any problem.
On how many websites can I use the products?
You can use your purchases on as many domains (websites) as you want, without any problems.
Does it include technical support?
Yes. We offer technical support Monday through Friday, during business hours UTC -3. This support includes assistance with issues related to download problems, installation problems, or errors with the purchased product.
Furthermore, support does not include configurations, customizations, tutorials, or services associated with the author.
Does my purchase have a warranty?
Yes, of course. If you have any problem that we can't solve, or if there's an external issue that doesn't have a general solution related to our service, you'll receive support and, if necessary, a full refund.
How do I access support?
After your purchase, from your user account, you can access the support section, where you can open a ticket and our team will assist you with whatever you need.
Download Previous Versions
If you have purchased this product, or have an active membership, you can download previous versions without any limits or restrictions.
| Product Name | Version | Size | Date | Download |
|---|---|---|---|---|
| No hay versiones anteriores registradas. | ||||
Related Products
Below we show you different products that share the same category.